Hướng dẫn setup Prometheus + Grafana để monitor dịch vụ
Trong bài viết này, mình sẽ hướng dẫn các bạn cách xây dựng một hệ thống monitor các dịch vụ trên Linux dựa trên Prometheus và Grafana.
_Note:_ _Đây là bài cộng tác giữa WikiVPS và CloudCraft. Cám ơnWikiVPS đã hỗ trợ trong quá trình thực hiện bài viết._
Giới thiệu sơ lược về Prometheus và Grafana
Prometheus
Prometheus là giải pháp monitor hệ thống (open source). Prometheus dùng các trình daemon cài sẵn trên các máy con để thu thập các thông tin cần thiết, giao tiếp với máy chủ quản lý monitor qua giao thức HTTP/HTTPs và lưu trữ data theo dạng time-series database (TSDB).
Prometheus có hỗ trợ một giao diện web đơn giản để cho các admin theo dõi thông tin hệ thống, HTTP API và Prometheus còn cung cấp một ngôn ngữ truy vấn rất mạnh (sẽ nói ở phần dưới). Tuy nhiên, phần lưu trữ dữ liệu của prometheus hiện vẫn chưa tốt lắm.
Grafana
Grafana là một giao diện/dashboard theo dõi hệ thống (opensource), hỗ trợ rất nhiều loại dashboard và các loại graph khác nhau để người quản trị dễ dàng theo dõi.
Grafana có thể truy xuất dữ liệu từ Graphite, Elasticsearch, OpenTSDB, Prometheus và InfluxDB. Grafana là một công cụ mạnh mẽ để truy xuất và biểu diễn dữ liệu dưới dạng các đồ thị và biểu đồ.
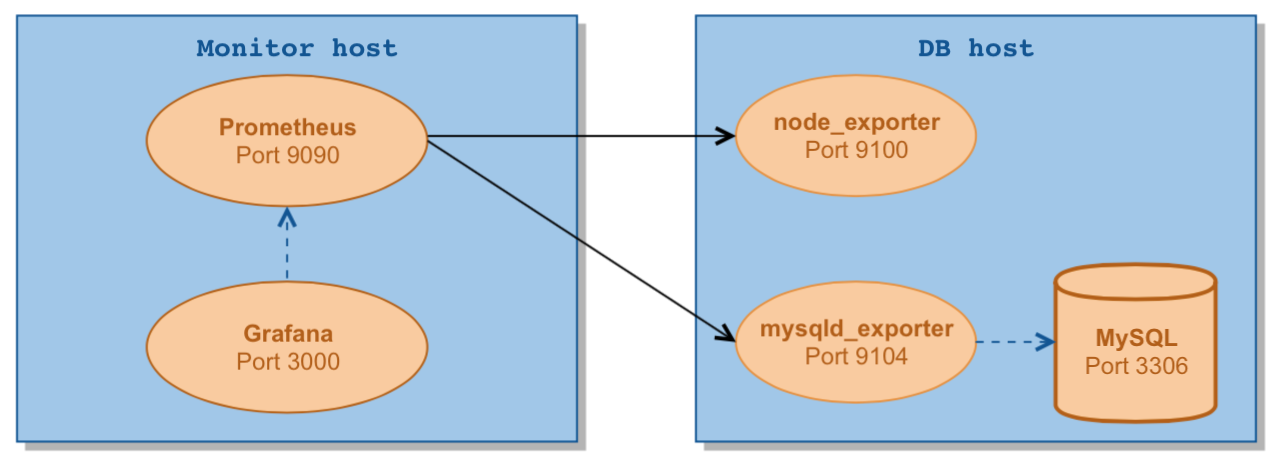
!prometheus-grafana-1_Mô hình ta sẽ thực hiện trong bài này_
Trong bài này, ta sẽ thực hiện theo dõi 1 server chạy DB MySQL và thực hiện cài đặt máy chủ prometheus trên monitor host và dùng Grafana để biểu diễn dữ liệu cho người dùng.
Data sẽ được Prometheus trên Master scrape về từ node Slave và được lưu trữ ở Master node. Grafana sẽ truy xuất dữ liệu trực tiếp từ Prometheus.
Set up Prometheus + Grafana cần phải setup theo mô hình Master – Slave, hướng dẫn sẽ được chia làm 2 phần tương ứng. Bài viết giả sử bạn đã có sẵn 2 host và đã cài đặt sẵn MySQL trên node Slave.
Master Node
Cài đặt Prometheus trên node Master Tải source của Prometheus và cấu hình file config của prometheus
# Download source cai dat cua Prometheus
cd ~
wget https://github.com/prometheus/prometheus/releases/download/v2.6.0/prometheus-2.6.0.linux-amd64.tar.gz
mkdir /opt/prometheus
tar zxf prometheus-2.6.0.linux-amd64.tar.gz -C /opt/prometheus --strip-components=1

# Tao user cho Prometheus
useradd --no-create-home --shell /bin/false prometheus

# Tao folder cho Prometheus
mkdir /etc/prometheus
mkdir /var/lib/prometheus

# Cau hinh file config Prometheus
cat << EOF > /etc/prometheus/prometheus.yml
global:
  scrape_interval:     5s
  evaluation_interval: 5s
scrape_configs:
  - job_name: linux
    static_configs:
      - targets: ['IP.Cua.Server.Slave:9100']
        labels:
          alias: vesta_cp

  - job_name: mysql
    static_configs:
      - targets: ['IP.Cua.Server.Slave:9104']
        labels:
          alias: vesta_cp
EOF
Tiếp tục thực hiện các bước cài đặt Prometheus
# Copy file thuc thi prometheus vao folder /user/local/bin
cp /opt/prometheus/prometheus /usr/local/bin/
cp /opt/prometheus/promtool /usr/local/bin/
cp -r /opt/prometheus/consoles /etc/prometheus
cp -r /opt/prometheus/console_libraries /etc/prometheus

# Phan quyen cho user prometheus
chown -R prometheus:prometheus /etc/prometheus
chown -R prometheus:prometheus /var/lib/prometheus
chown prometheus:prometheus /usr/local/bin/prometheus
chown prometheus:prometheus /usr/local/bin/promtool

# Chay prometheus
prometheus /usr/local/bin/prometheus \
    --config.file /etc/prometheus/prometheus.yml \
    --storage.tsdb.path /var/lib/prometheus/ \
    --web.console.templates=/etc/prometheus/consoles \
    --web.console.libraries=/etc/prometheus/console_libraries
Tạo file Systemd cho Prometheus
Ta cần phải tạo 1 file systemd để tự động restart lại service khi bị crash hoặc reboot server. Service monitor mà để bị die thì chuối lắm :))))
vim /etc/systemd/system/prometheus.service

[Unit]
Description=Prometheus
Wants=network-online.target
After=network-online.target

[Service]
User=prometheus
Group=prometheus
Type=simple
ExecStart=/usr/local/bin/prometheus \
    --config.file /etc/prometheus/prometheus.yml \
    --storage.tsdb.path /var/lib/prometheus/ \
    --web.console.templates=/etc/prometheus/consoles \
    --web.console.libraries=/etc/prometheus/console_libraries

[Install]
WantedBy=multi-user.target
Restart lại service prometheus và enable tính năng auto restart của prometheus
systemctl daemon-reload
systemctl restart prometheus
systemctl status prometheus
systemctl enable prometheus
Truy cập vô http://master_IP:9090 để kiểm tra thử, xong rồi thì nhớ đóng firewall lại
Monitored Nodes
Cài đặt 2 agent trên node được monitor
Có 2 loại agent, loại Node agent dùng để kiểm tra các thông số cơ bản của 1 server như: RAM, CPU, Disk, Network.
Và loại thứ 2 được nhắc tới trong bài này là mysql agent dùng để monitor trực tiếp mysql. Cần phải tạo account mysql cho prometheus agent truy xuất được thông tin từ mysql.
# Tai 2 agent ve node Slave
wget https://github.com/prometheus/node_exporter/releases/download/v0.17.0/node_exporter-0.17.0.linux-amd64.tar.gz
wget https://github.com/prometheus/mysqld_exporter/releases/download/v0.11.0/mysqld_exporter-0.11.0.linux-amd64.tar.gz

# Tao folder chua 2 agent
mkdir /opt/prometheus_exporters

# Giai nen source cai dat
tar zxf node_exporter-0.17.0.linux-amd64.tar.gz -C /opt/prometheus_exporters
tar zxf mysqld_exporter-0.11.0.linux-amd64.tar.gz -C /opt/prometheus_exporters

# Start Linux agent
cd /opt/prometheus_exporters/node_exporter-0.17.0.linux-amd64
./node_exporter &
Với loại agent cho MySQL thì ta cần phải tạo 1 tài khoản MySQL có quyền read table _performance_schema_ Đăng nhập vào MySQL bằng acc root và tạo 1 tài khoản như sau:
# Login vao MySQL voi quyen root va tao 1 tai khoan de monitor MySQL
mysql> GRANT REPLICATION CLIENT, PROCESS ON <em>.</em> TO 'prom'@'localhost' identified by 'wikivps@passwordcuaban';
mysql> GRANT SELECT ON performance_schema.* TO 'prom'@'localhost';

# Tạo file config cho mysqld_exporter
cd /opt/prometheus_exporters/mysqld_exporter-0.11.0.linux-amd64

vim .my.cnf
[client]
user=prom
password=wikivps@paswordcuaban

# Chay mysql agent
./mysqld_exporter -config.my-cnf=".my.cnf" &
Cài đặt Grafana
Tải gói cài đặt của Grafana về
wget https://dl.grafana.com/oss/release/grafana-5.4.2-1.x86_64.rpm
yum localinstall grafana-5.4.2-1.x86_64.rpm
vim /etc/grafana/grafana.ini
Tải bộ dashboard của MySQL
git clone https://github.com/percona/grafana-dashboards.git
cp -r grafana-dashboards/dashboards /var/lib/grafana
Start service Grafana-Server
systemctl start grafana-server
systemctl status grafana-server
systemctl enable grafana-server
Hướng dẫn add monitor trên Grafana
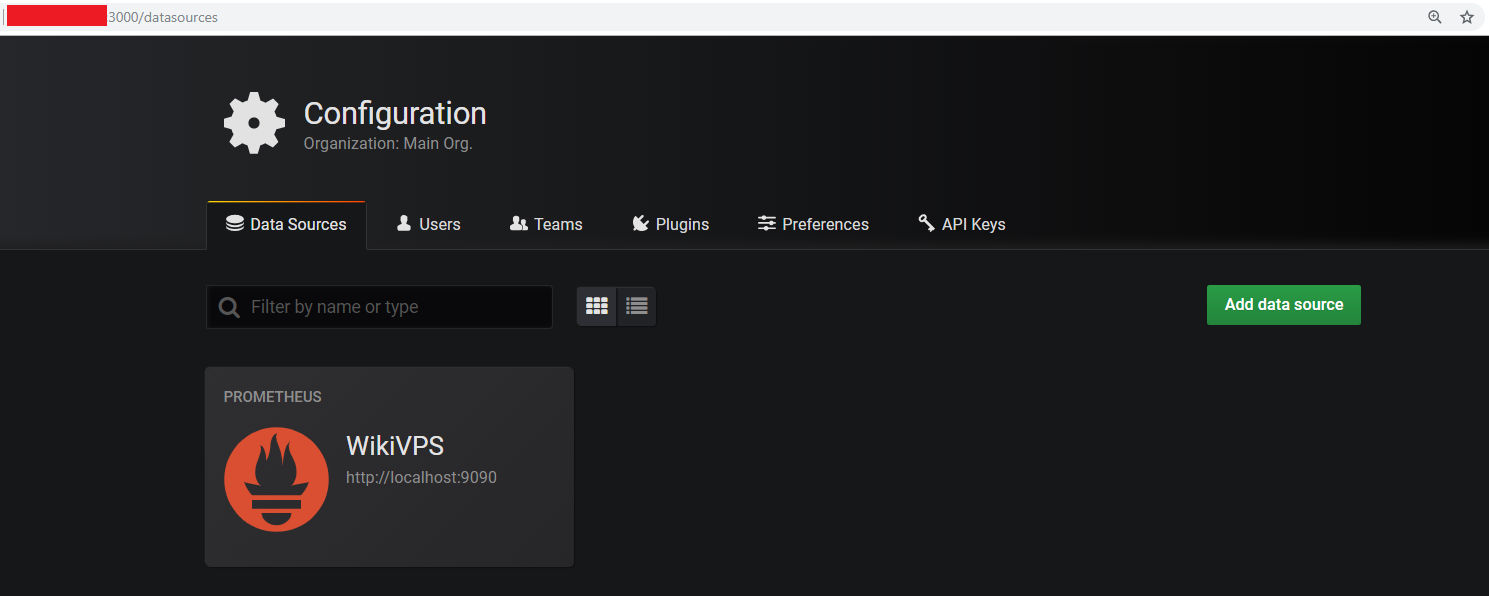
Import data source !prometheus-grafana-2
Import data source là Prometheus, do đang chạy chung host nên import http://localhost:9090
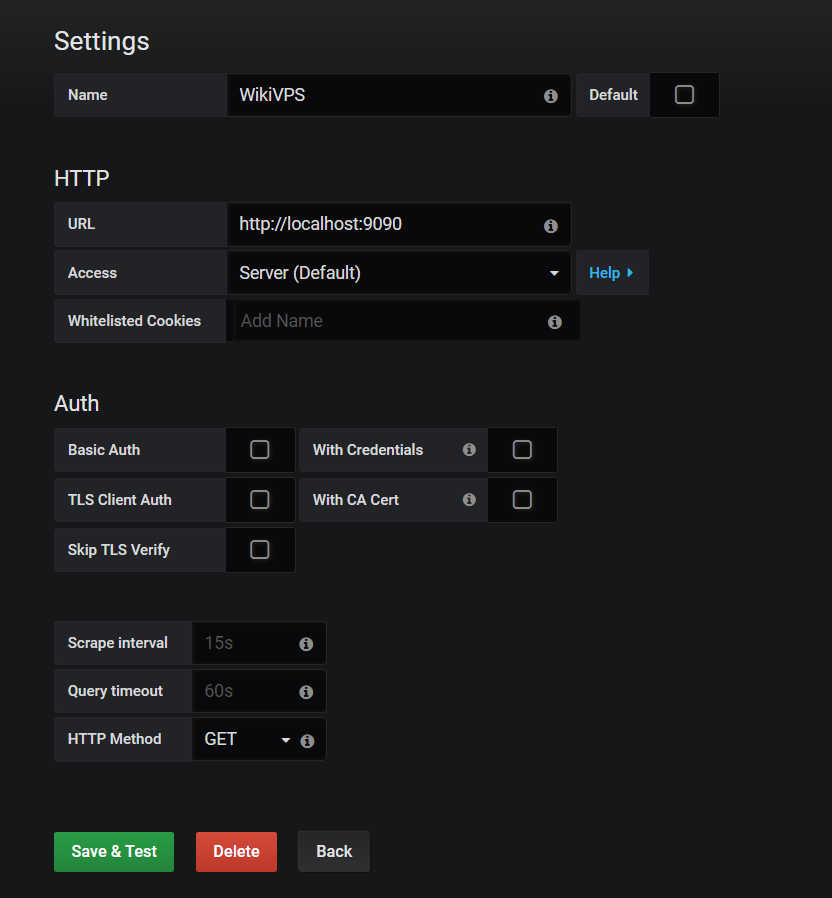
!prometheus-grafana-3 Do chung host nên không cần thiết lập chứng thực và SSL, nếu chạy khác host thì cần set chứng thực SSL để đảm bảo an toàn. Tạo Graph và Query!prometheus-grafana-4
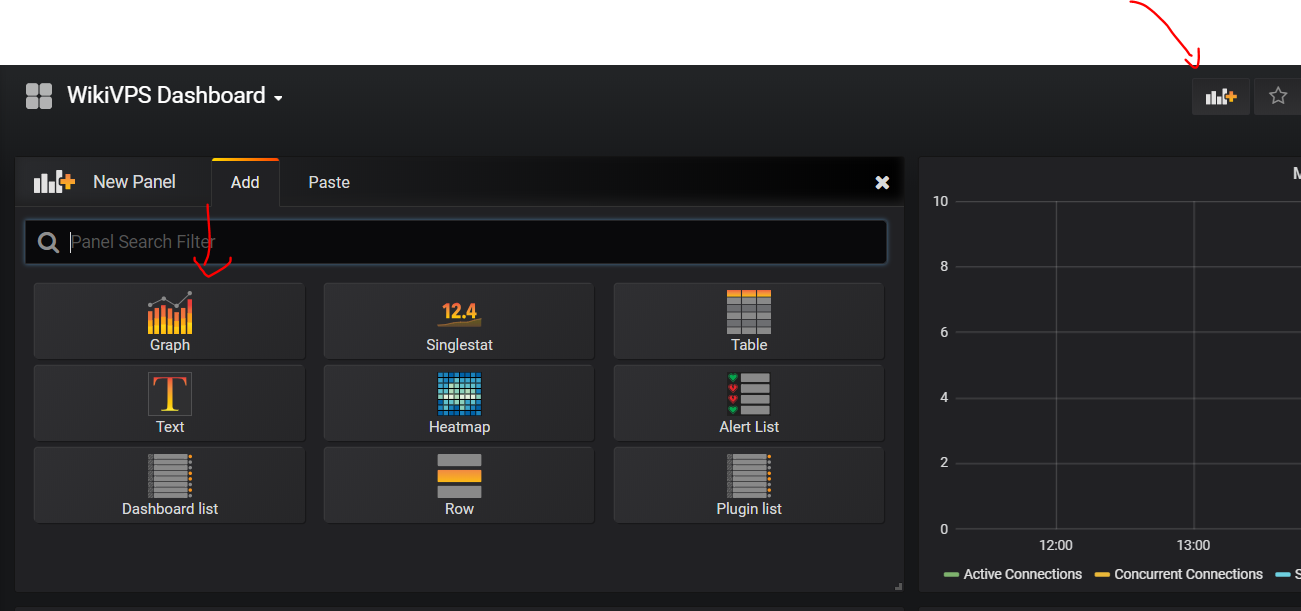
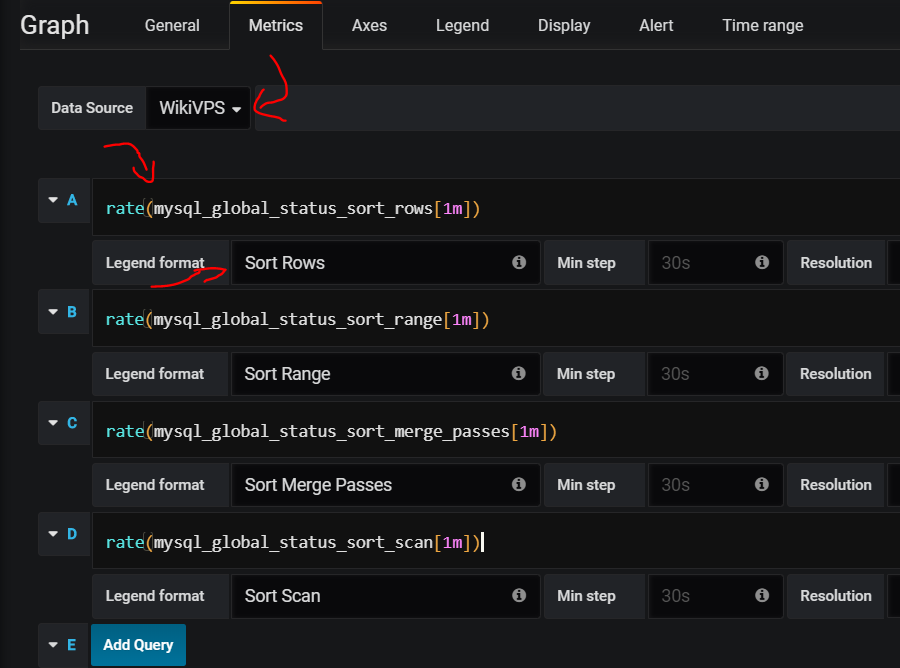
_Chọn WikiVPS Dashboard = > Add New Panel => Graph_
!prometheus-grafana-5_Chọn Data Source là WikiVPS = > Điền câu query, ở đây là tính số lần sort trong 1 phút_!prometheus-grafana-6Điền câu query xong thì chọn nút Save trên góc và quay lại màn hình chính
Một số mẫu câu query trên Grafana
Số lần sort table của MySQL trong 1 phút
rate(mysql_global_status_sort_rows[1m])
rate(mysql_global_status_sort_range[1m])
rate(mysql_global_status_sort_merge_passes[1m])
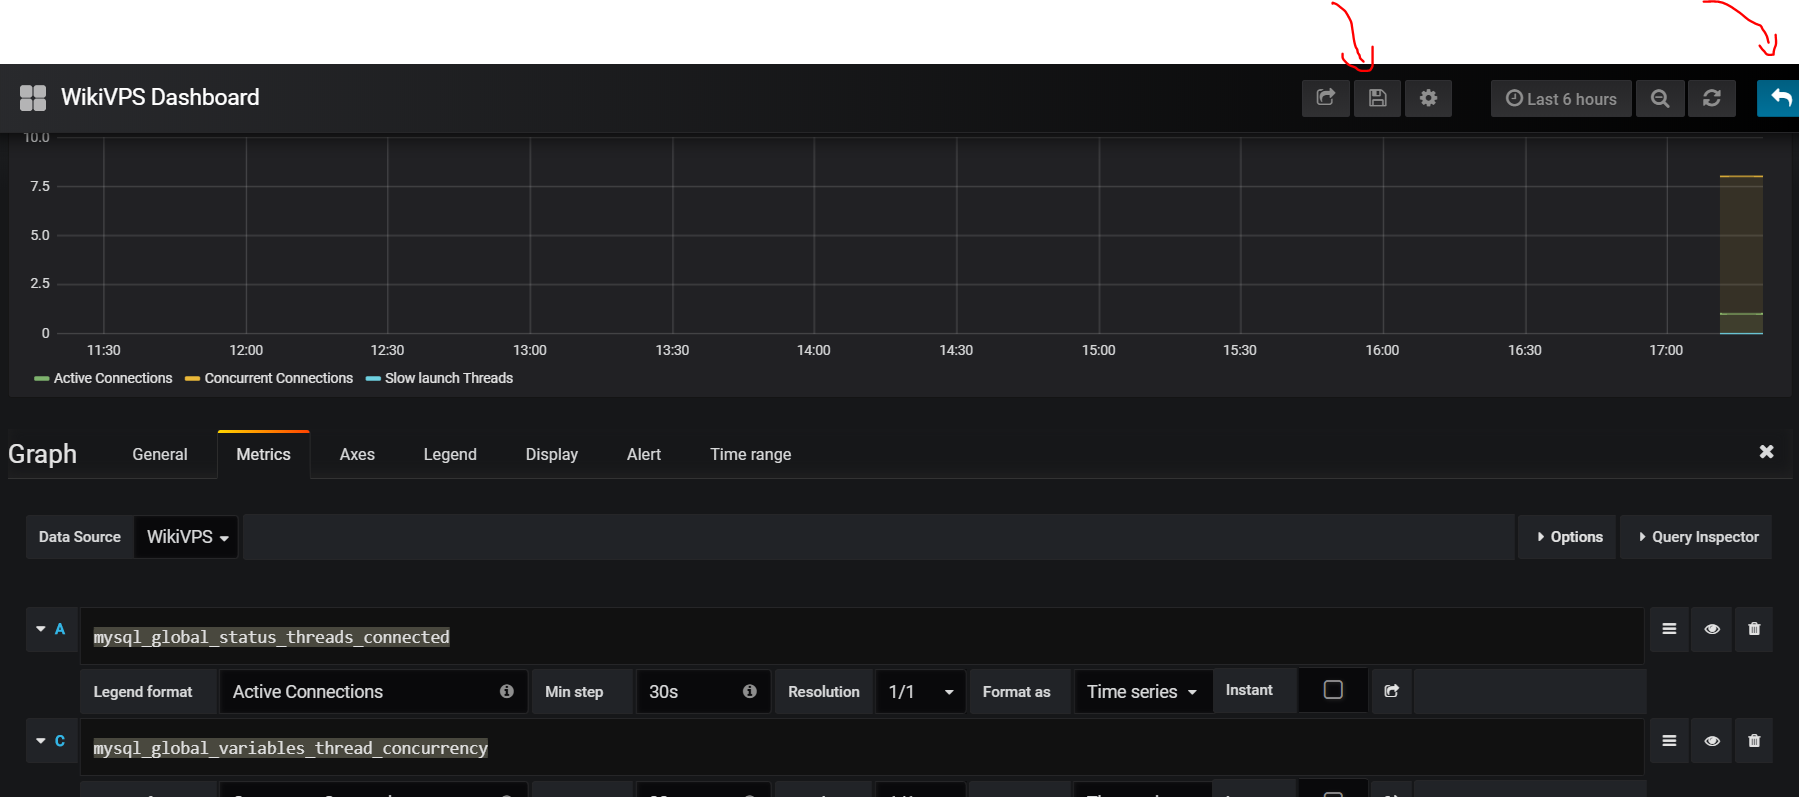
rate(mysql_global_status_sort_rows[1m])Số thread đang chạy của MySQL
mysql_global_status_threads_connected
mysql_global_status_slow_launch_threads
mysql_global_variables_thread_concurrency
Tổng số câu query phân loại theo command
sum by (command) ( rate(mysql_global_status_commands_total{ command=~"(select|insert|update|delete)"}[1m]))Load của Linux theo phút
node_load1
node_load15
node_load15
Tổng network traffic của server theo phút
rate(node_network_transmit_bytes_total{device!="lo"}[1m]) or irate(node_network_transmit_bytes_total{device!="lo"}[1m])
rate(node_network_receive_bytes_total{device!="lo"}[1m]) or irate(node_network_receive_bytes_total{device!="lo"}[1m])
Slow query của MySQL
rate(mysql_global_variables_slow_launch_time[1m])
rate(mysql_global_variables_slow_query_log[1m])
rate(mysql_global_status_slow_launch_threads[1m])
rate(mysql_global_status_slow_queries[1m])
Tham khảo
https://github.com/prometheus/node_exporter https://github.com/prometheus/mysqld_exporter https://www.percona.com/blog/2016/02/29/graphing-mysql-performance-with-prometheus-and-grafana/ https://blog.serverdensity.com/how-to-monitor-mysql/ https://www.slideshare.net/YoungHeonKim1/mysql-monitoring-using-prometheus-grafana